XAUUSD Analysis | Gap Potential as Tensions Escalate!Hey Traders,
In the coming week, we are expecting Gold (XAUUSD) to potentially open with a gap higher, driven by the ongoing escalations in the Middle East — particularly tensions involving Israel, the United States, and Iran, with increasing regional involvement.
In periods of geopolitical instab

The best trades require research, then commitment.
Get started for free$0 forever, no credit card needed

Scott "Kidd" PoteetPolaris Dawn astronaut

Where the world does markets
Join 100 million traders and investors taking the future into their own hands.

Oil - the biggest week in 40 yearsOver the past four years, almost every trader or commodities analyst has discussed the ramifications of Iran closing the Strait of Hormuz and the impact on oil prices. That hypothesis has now finally materialised.
It's still too early to say how oil markets will be impact. Previous regional wars h

At the Edge: Breakdown or New Rally in Coinbase?On the daily timeframe, the stock has retraced sharply from its 400+ rally peak and is now sitting on a major historical support zone around $155–165.
The long-term moving average is sloping downward and price remains below it, meaning the medium-term structure is still corrective. This support rea

S&P500 could go up nowHi traders,
Last week SPX500USD followed exactly the path of my arrow.
So I think this bigger Triangle pattern (red wave 4) could now be finished.
In that case next week we could see an impulsive upmove.
Let's see what the market does and react.
Trade idea: Wait for an impulsive wave up and a co

Australian Stock Index ASX 200 Reaches Record HighAustralian Stock Index ASX 200 Reaches Record High
As the chart of the ASX 200 index shows, today’s candle has moved above the 9,210 level, marking a fresh all-time high. Since the start of the year, the benchmark of Australian equities has gained more than 5.6%, supported by:
→ A strong earnings

WTI Oil Pulls Back from Its 2026 HighWTI Oil Pulls Back from Its 2026 High
As the XTI/USD chart shows, the price of a barrel:
→ set fresh 2026 highs above $67 earlier this week;
→ but yesterday posted a sharp reversal lower (as indicated by the blue arrow).
The spike in volatility was driven by conflicting reports from Geneva, where

DOGE Distribution Warning: Is a Sharp Flush Coming?Yello Paradisers! Are you seeing what smart money is quietly doing on #DOGE right now, or are you about to get caught in the next possible sharp downside move? At first glance, this looks like “just another healthy pullback.” That’s exactly how retail traders get trapped. But when we read the struct

Bitcoin 3-Day 'Death Cross' Signalling 50% Incoming Drop In this quick study I'm showing how in Prior Cycles Bitcoin has seen additional 40 to 50% drops from where we are now.
On this 3-day charge and looking at the crossover of the 50. EMA below the 200. EMA in blue, we've seen previously deeper corrections in the 50% range.
So while we could see a rec

Gold — Quiet Consolidation as Market Awaits DirectionYesterday was a relatively quiet session for Gold traders, with price fluctuating inside a tight range and showing limited directional momentum.
As seen on the chart, after the drop from the 5250 zone — a move that also filled Monday’s opening gap — buyers stepped back in and pushed price once agai

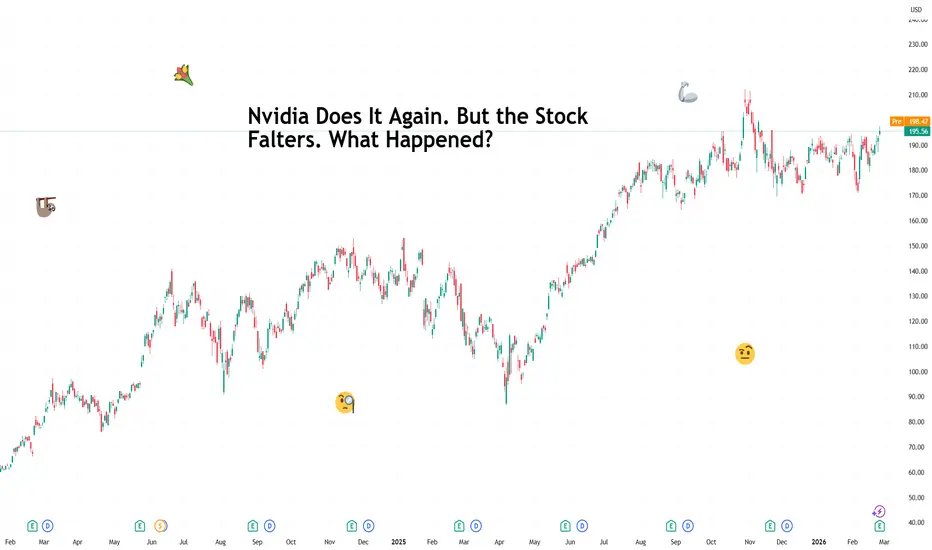
Nvidia Does It Again. But the Stock Falters. What Happened?“Great quarter guys,” would be an understatement.
Nvidia NASDAQ:NVDA delivered what most companies would describe as a generational quarter . Profit surged 94% year over year, reaching $43 billion, while revenue climbed 73% to $68.1 billion, comfortably ahead of consensus estimates.
Data cente
See all editors' picks ideas
Earnings Snapshot [Trendoscope]🎲 Overview
The Earnings Snapshot is a custom indicator designed to provide traders and investors with a quick, visual overview of a stock's earnings performance and its impact on price action. This tool automates the analysis of earnings reports by fetching historical and future earnings data,
Pine Script® indicator

Market Structure Dashboard | Flux ChartsGENERAL OVERVIEW
Market Structure Dashboard is a multi-timeframe market structure analysis indicator. It combines EMA trend detection, swing high/low tracking, market structure labels, Order Block detection, Fair Value Gap detection, liquidity sweep detection, volume analysis, volatility analysis,
Pine Script® indicator

Smart NR2-NR20 and Inside Bar (Zeiierman)█ Overview
Smart NR2–NR20 + Inside Bar (Zeiierman) is a compression + breakout scanner that searches for the tightest Narrow Range (NR) condition across NR2…NR20, plus optional Inside Bar detection. When a valid compression forms, it draws a box around the setup, projects the high/low levels for
Pine Script® indicator

TASC 2026.03 One Percent A Week█ OVERVIEW
This script implements "A High-Probability Weekly Trading Strategy For TQQQ" as dictated in the March 2026 edition of the TASC Traders' Tips , "Trading Snapbacks In A Leveraged ETF”. In this article the author creates a mean reversion strategy intended for systematic and discretionary
Pine Script® strategy

Smart Trader, Concentric Candles & Aristotelian Cycloids
Smart Trader, Episode 05
Concentric Candles & Aristotelian Cycloids
by Ata Sabanci
The Spark — How a 2,000-Year-Old Paradox Found the Charts
━━━━━━━━━━━━━━━━━━━━━━━━━━━━━━━━━━━━━━
It started with a film about Aristotle's Wheel
Paradox — a problem that puzzled mathematicians
for two mille
Pine Script® indicator

MovingAveragesLibrary "MovingAverages"
A collection of O(1) numerically stable moving averages that support anchors and fractional lengths up to 100k bars.
Pine Script has a robust set of moving averages suitable for a majority of cases, making these alternatives useful only if you need anchoring, fractional
Pine Script® library

Clusters Volume Profile [LuxAlgo]The Clusters Volume Profile indicator utilizes K-Means clustering to categorize historical price action into distinct groups and generates individual volume profiles for each detected cluster. This tool provides a unique perspective on volume distribution by isolating price behaviors based on prox
Pine Script® indicator

Central Bank Liquidity Gap IndicatorThis indicator measures the gap between global liquidity growth and stock market growth to identify potential buying opportunities.
Liquidity drives markets. When central banks print money, that liquidity eventually flows into stocks and other assets. If we spot when liquidity growth is outpacing
Pine Script® indicator

Peak Trading Activity Graphs [LuxAlgo]The Peak Trading Activity Graphs displays four graphs that allow traders to see at a glance the times of the highest and lowest volume and volatility for any month, day of the month, day of the week, or hour of the day. By default, it plots the median values of the selected data for each period. T
Pine Script® indicator

Smart Trader, Episode 03, by Ata Sabanci, Candles and TradelinesA volume-based multi-block analysis system designed for educational purposes. This indicator helps traders understand their current market situation through aggregated block analysis, volumetric calculations, trend detection, and an AI-style narrative engine.
━━━━━━━━━━━━━━━━━━━━━━━━━━━━━━━━━━━━━━━
Pine Script® indicator

See all indicators and strategies
Community trends
At the Edge: Breakdown or New Rally in Coinbase?On the daily timeframe, the stock has retraced sharply from its 400+ rally peak and is now sitting on a major historical support zone around $155–165.
The long-term moving average is sloping downward and price remains below it, meaning the medium-term structure is still corrective. This support rea
Nvidia Head and Shoulder PatternNvidia (NVDA) is showing a textbook Head & Shoulders pattern on the weekly timeframe. After failing to reclaim the $212 ATH, the price has retraced to a critical support zone between $172–$177. A confirmed weekly close below this neckline signals a shift in momentum toward the $150 psychological sup

APPLE Massive Long! BUY!
My dear followers,
I analysed this chart on APPLE and concluded the following:
The market is trading on 264.22 pivot level.
Bias - Bullish
Technical Indicators: Both Super Trend & Pivot HL indicate a highly probable Bullish continuation.
Target - 268.48
Safe Stop Loss - 261.43
About Used Indic

$MSFT 40% Move Incoming?NASDAQ:MSFT is closing in on its 200 MA, last time it retraced close to the 200 MA, the stock ran up +60%. Then before that it made a double bottom & Ran up 115%. I like NASDAQ:MSFT BUYS ABOVE $375 AREA 40% MOVE 1:5 RR!

OXY Occidental Petroleum Corporation Options Ahead of EarningsAnalyzing the options chain and the chart patterns of OXY Occidental Petroleum Corporation prior to the earnings report this week,
I would consider purchasing the 55usd strike price Calls with
an expiration date of 2026-9-18,
for a premium of approximately $1.98.
If these options prove to be profita

NFLX – Structural Shift After CompressionNFLX is showing a meaningful structural transition. Even before earnings, price was already signaling intention to break out of its compression structure. Thursday and Friday printed strong bullish candles — that is not random.
Momentum has clearly shifted.
Current Positioning
- Price is holding

TESLA: Market Sentiment & Price Action
The recent price action on the TESLA pair was keeping me on the fence, however, my bias is slowly but surely changing into the bullish one and I think we will see the price go up.
Disclosure: I am part of Trade Nation's Influencer program and receive a monthly fee for using their TradingView char

PLTR - buyPLTR stocks gonna grow 600% up to 2.58 T of market cap in next 2-5 years and hit 1092% per share I am assuming

Week 10 of 52 – NVIDIA – Absorption or Distribution?After a powerful AI-driven expansion, NVDA is now compressing inside a defined structural range.
Momentum has slowed. Volatility is tightening.
This is typically where the market makes a decision. Is this absorption before continuation… or distribution before rotation?
Rather than chasing strengt

CROX will start the flight in 2027As my EW analysis shows, I expect price consolidation to tighten and volatility to increase as we move closer to the triangle apex. Break-out shall happen before 2028. And then strong trend will start with price towards at least $300.
After the trend exhausts, cycle wave IV (black color) counter

See all stocks ideas
Today
NCLHNorwegian Cruise Line Holdings Ltd.
Actual
—
Estimate
0.26
USD
Today
ADTADT Inc.
Actual
—
Estimate
0.22
USD
Today
DRVNDriven Brands Holdings Inc.
Actual
0.30
USD
Estimate
0.28
USD
Today
CRMTAmerica's Car-Mart, Inc.
Actual
—
Estimate
−0.26
USD
Today
ULHUniversal Logistics Holdings, Inc.
Actual
—
Estimate
−0.05
USD
Today
MOBMobilicom Limited
Actual
—
Estimate
−0.57
USD
Today
VTVTvTv Therapeutics Inc.
Actual
—
Estimate
−1.08
USD
Today
TBPHTheravance Biopharma, Inc.
Actual
—
Estimate
1.03
USD
See more events
Community trends
Bitcoin Daily CLS range Model 1 - TP 73K Hi friends, new range created. As always we are looking for the manipulation in to the key level around the range. Don't forget confirmation switch from manipulation phase to the distribution phase to make the setup valid. Stay patient and enter only after change in order flow. If price reaches 50%

BTCUSDT False Break of Resistance – Possible Short ScenarioHello traders! Here’s my technical outlook based on the current BTCUSDT (1H) chart structure. Price previously traded inside a broad descending channel, where sellers remained in control and the market printed a clear sequence of lower highs and lower lows. During this phase, multiple breakdown atte

Bitcoin - Most important level to hold for the bulls!Bitcoin is currently trading around $66,100 after bouncing from the recent lows near $63,000. The market structure shows a recovery into a key higher-timeframe imbalance zone, where price is now attempting to stabilize. This area is technically significant because it combines both a Daily and a 4h f

Bitcoin 4H Moving Averages EMA55 & EMA89 —$85,000 Becomes ActiveAll long-term support levels have been recovered (some are still in process but this is a done deal). I don't think there is need to mention them again. We are winning.
We've been bullish since 6-February and the recent higher low, $62,500, validates a higher high comes next.
Many traders, analyst

BTCUSD Prediction: Is Bitcoin Preparing for a Massive Breakout?BTCUSD recently completed a strong upward expansion that shifted the broader price sequence into a constructive phase. After printing a significant peak, price transitioned into a controlled pullback, reflecting profit-taking and short-term distribution rather than aggressive liquidation.
The curre

BTCUSDT: Faces Strong Resistance - Bearish Continuation in PlayHello everyone, here is my breakdown of the current BTCUSDT setup.
Market Analysis
BTCUSDT has been trading within a broader descending structure, defined by a falling resistance trend line that continues to cap upside attempts. Earlier, price consolidated inside a horizontal range, showing tempo

ETH 4hr green dot printing at oversoldETH is getting ready to print a 4hr green dot that could push it back up to the top of the fair value range.
From there, we can get rejected back down to the POC or break through and get accepted to the value range above. This would take us to 3k pretty quickly since there is not much volume resist

Key Wyckoff Events for Cardano + VolumeThe Wyckoff Method analyzes market cycles through four main phases—Accumulation, Markup, Distribution, and Markdown—driven by institutional "smart money". It uses five distinct phases (A-E) and specific events like Buying/Selling Climaxes and Springs to identify entry/exit points, acting on the laws

One last move down for BitcoinHi traders,
Last week Bitcoin didn't broke the previous swing low. So I think this pattern could be an expanding ending diagonal.
In that case we could see one more move down to break the previous swing low.
After that it could go up again.
Let's see what the market does and react.
Trade idea:

The OP says a buying opportunity has arisenWith strong bullish momentum candles forming after the creation of a SW L at the bottom, followed by a bullish CH, signs of buyer presence have appeared on the chart.
A trendline liquidity level has been swept, with liquidity resting below it. A bear trap was formed and price has since reversed to

See all crypto ideas
Triangle Breakout Confirmed | Continuation Bias Above 5315XAUUSD 2H – Triangle Breakout Confirmed | Continuation Bias Above 5315
Symbol: XAUUSD
Timeframe: 2H (context from price action & structure)
State: Post‑triangle breakout with continuation bias
━━━━━━━━━━━━━━━━━━
Macro + Sentiment Context (Why gold is bid)
- The Middle East risk

XAUUSD Analysis | Gap Potential as Tensions Escalate!Hey Traders,
In the coming week, we are expecting Gold (XAUUSD) to potentially open with a gap higher, driven by the ongoing escalations in the Middle East — particularly tensions involving Israel, the United States, and Iran, with increasing regional involvement.
In periods of geopolitical instab
GOLD 1H CHART ROUTE MAP UPDATE & TRADING PLAN FOR THE WEEKHey Everyone,
Please see our 1h chart levels and targets for the coming week.
We are seeing price play between two weighted levels with a gap above at 5334 and a gap below at 5198, as support. We will need to see ema5 cross and lock on either weighted level to determine the next range.
We will se

Gold Weekly Levels Fresh Liquidity at 5315/5335 Pullback Warning🪙 Gold WEEKLY OUTLOOK UPDATE
🔱 GOLD WEEKLY SNAPSHOT — EXECUTIVE SUMMARY
🩶Get high probability breakout alerts in real time with Strong Breakouts MTF | ProjectSyndicate
🩶Get the new script today and add to your Favorites.
🟢 Bulls secured a strong weekly close near 5283, confirming upside moment

GOLD - Accelerated growth. Rally due to geopolitics FX:XAUUSD , after breaking out of consolidation, closed Friday's session on a fairly positive note at 5275, indicating a possible continuation of growth. However, events over the weekend confirm the expected outcome...
On Saturday , February 28, there was a sharp escalation of the conflict in

XAUUSD BULLISH SIDE POSSIBLE Hello Traders hope everyone is good 👍🏻
Here's my idea on XAUUSD and what do you think about my GOLD analysis? Please share in comment section and follow me for more updates on XAUUSD
Price is moving with clear market structure, confirming a valid BOS (Break of Structure) and strong institutional

Lingrid | GOLD Weekly Outlook: Can Geopolitics Drive $6K Rally?OANDA:XAUUSD might surge as investors flee to safety amidst escalating the recent US-Israel strikes on Iran. This geopolitical shockwave drives a massive shift into precious metals, setting the stage for a likely gap-up open this Monday. The market is eyeing a breach of the current record highs nea

When War Escalates, Commodities RespondHistory shows one consistent pattern:
When geopolitical tensions escalate, capital rotates into hard assets.
Not out of emotion.
Out of protection.
Let’s break down what price is actually telling us.
Gold - Structure Supports the Narrative
Gold has been overall bullish, trading within a rising

Gold Builds Bullish Pressure Toward 5,380 ResistanceHello traders! Here’s my technical outlook based on the current Gold vs U.S. Dollar (XAUUSD, 4H) chart structure. Price previously advanced within a well-defined ascending channel, where buyers maintained control and the market formed a consistent pattern of higher highs and higher lows. During this

XAUUSD Long: Ascending Channel Holds - 5,260 as Next TargetHello traders! Here’s my technical outlook on XAUUSD (2H) based on the current market structure. Gold initially moved within a clearly defined descending structure, guided by a strong supply trend line that consistently capped upside attempts and maintained bearish pressure. This phase was character

See all futures ideas
EURUSD: Holding Support Sets Up a Move Toward 1.1860 ResistanceHello everyone, here is my breakdown of the current EURUSD setup.
Market Analysis
EURUSD previously moved within a well-defined upward channel, showing strong bullish momentum and a clear sequence of higher highs and higher lows. Multiple breakout confirmations along the channel highlighted susta

EUR/USD Outlook: Dollar Strength Surges Amid Iran TensionsEUR/USD is currently navigating a high-stakes compression zone around 1.1818, forming a series of lower highs against steady support near 1.1760, signaling a massive accumulation of market energy that could trigger a decisive breakout in the coming sessions. This technical consolidation is unfolding

TheGrove | CADJPY sell | Idea Trading AnalysisCADJPY is moving on Resistance area and is testing the upper boundary of an ascending channel and showing signs of rejection, we may see a corrective move towards lower support zones.
We expect a decline in the channel after testing the current level.
We expect a decline in the channel after testin

EURUSD Long: Rounded Bottom Signals Recovery Toward 1.1850Hello traders! Here’s my technical outlook based on the current EURUSD (1H) chart structure. Price initially traded under a dominant descending trend line, where sellers consistently capped upside attempts and the market printed a sequence of lower highs, confirming bearish control. During this phas

85% of Traders Are Short EUR/GBP…Over the past few days, I have been closely monitoring EUR/GBP as the market structure is beginning to show a very interesting shift compared to previous weeks. After an extended bearish phase within a well-defined descending channel, price swept liquidity inside the main demand zone around 0.8620–0

AUDUSD: The World Watches the Drama. Capital Buys CarryWhile the medium-term trajectory points toward 0.75 , near-term conditions favor a corrective pullback into the zone, potentially extending toward 0.694 before the broader uptrend resumes
Spoiler: Potential scenarios are detailed below. For those looking for the final verdict, scroll to the

NZDUSD is approaching a decent support zone! Hey Traders, in today's trading session we are monitoring NZDUSD for a buying opportunity around 0.59800 zone, NZDUSD is trading in an uptrend and currently is in a correction phase in which it is approaching the trend at 0.59800 support and resistance area.
Trade safe, Joe.

EURUSD: Support & Resistance Analysis for Next Week 🇪🇺🇺🇸
Here is my updated support and resistance analysis
for EURUSD for next week.
Consider these structures for pullback/breakout trading.
❤️Please, support my work with like, thank you!❤️
I am part of Trade Nation's Influencer program and receive a monthly fee for using their TradingView charts

Price action after going back to review the chart daily liquidity sweep was activated and price closed below the highest candle this implies price is going down

CADJPY BULLISH BIAS SETUPDescending triangle reversal: A descending triangle pattern broke out to the bullish side.
Support validation: Price made multiple reversals, but bullish support held consistently above the initial breakout levels.
1-Hour signal: A new bullish breakout on the 1-hour timeframe signifies a buy conti

See all forex ideas
Trade directly on Supercharts through our supported, fully-verified, and user-reviewed brokers.


